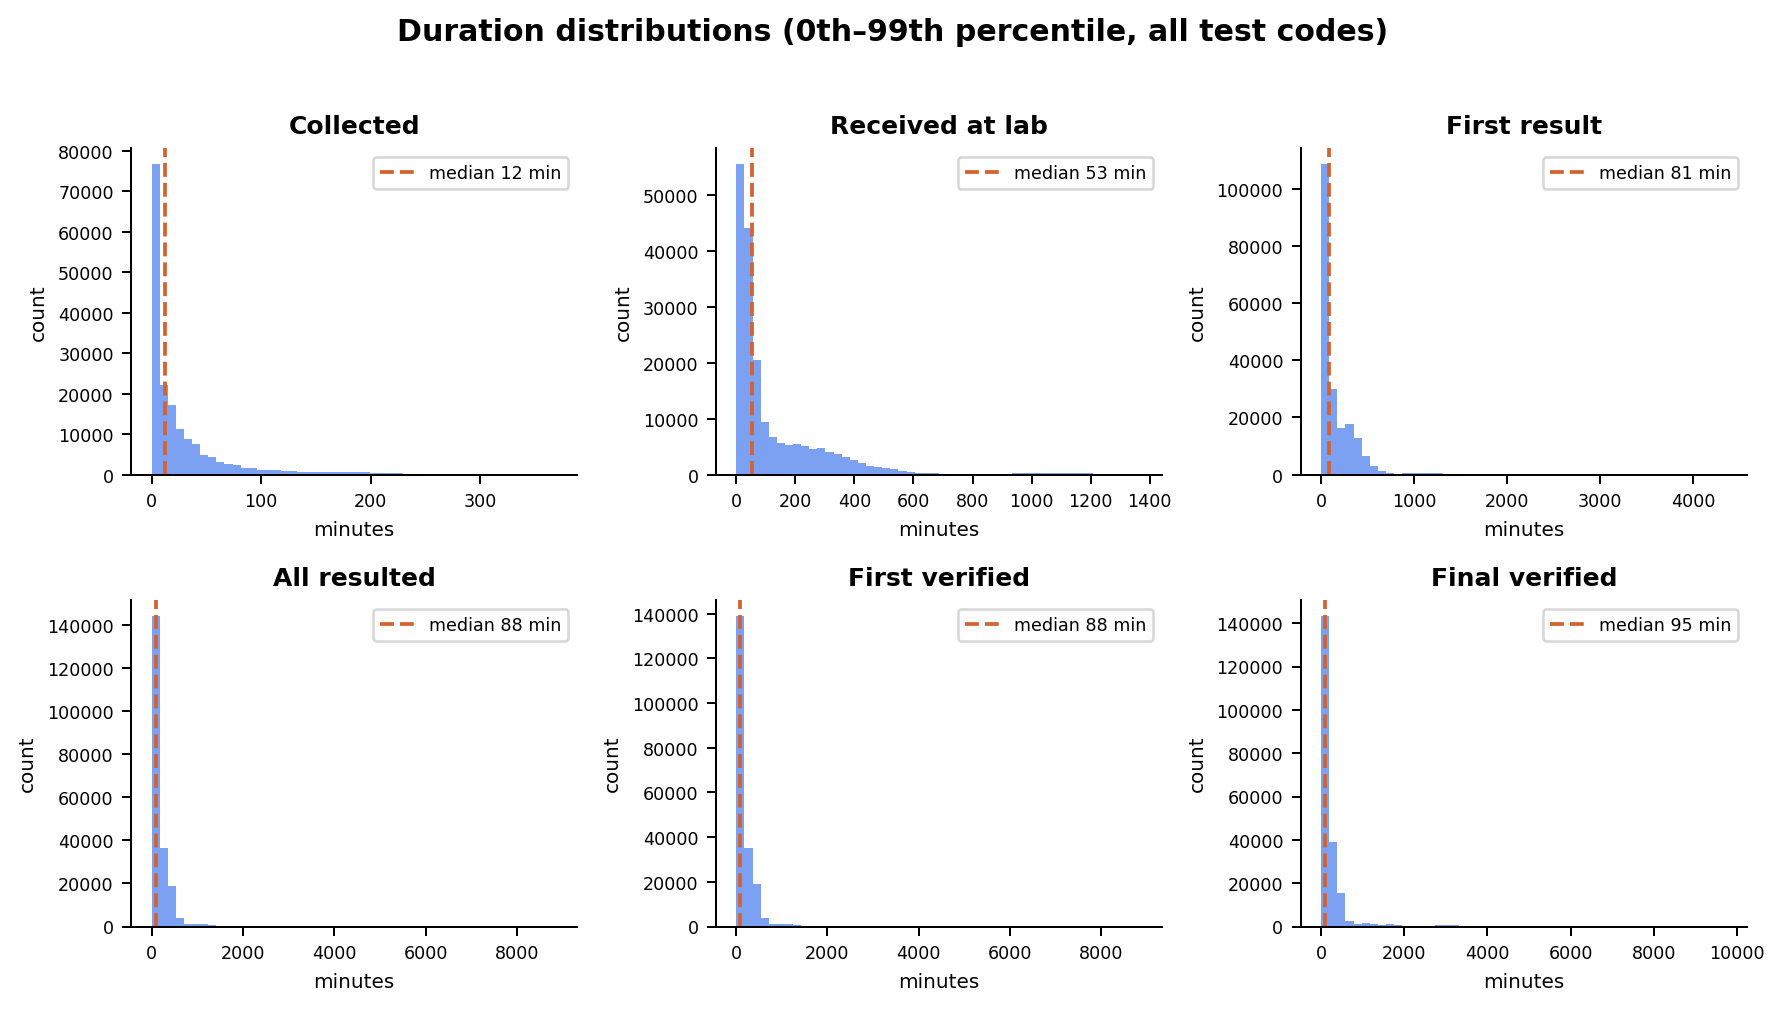
Minutes from order to completion. Bands show the middle 50%. Click any stage for the full distribution.
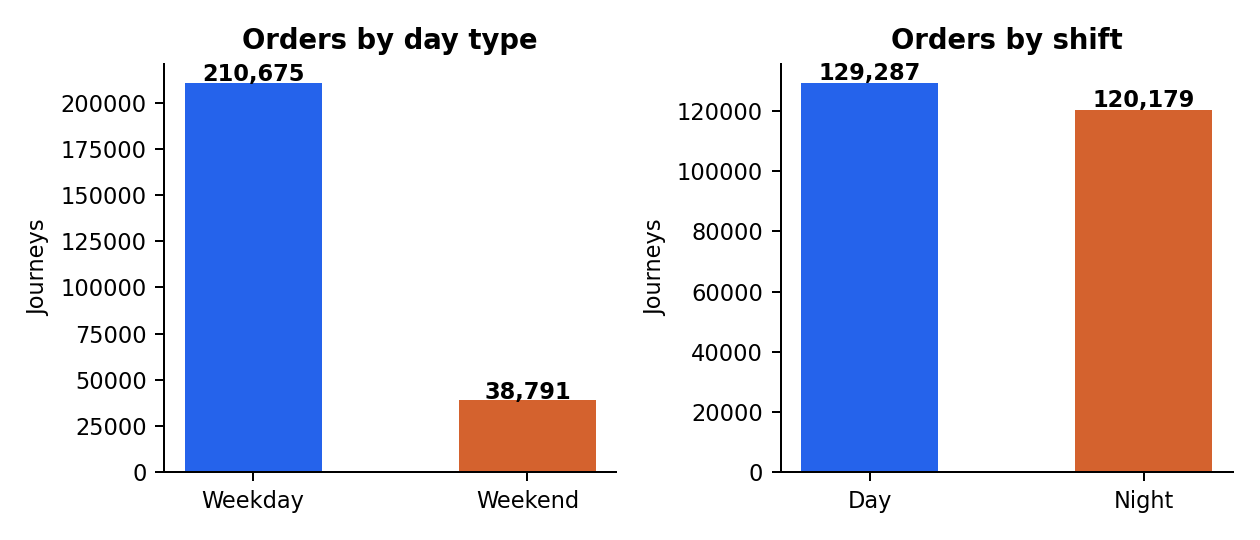
Same pipeline, two cohorts. Weekdays process 5× the volume but run slower at every stage after collection.
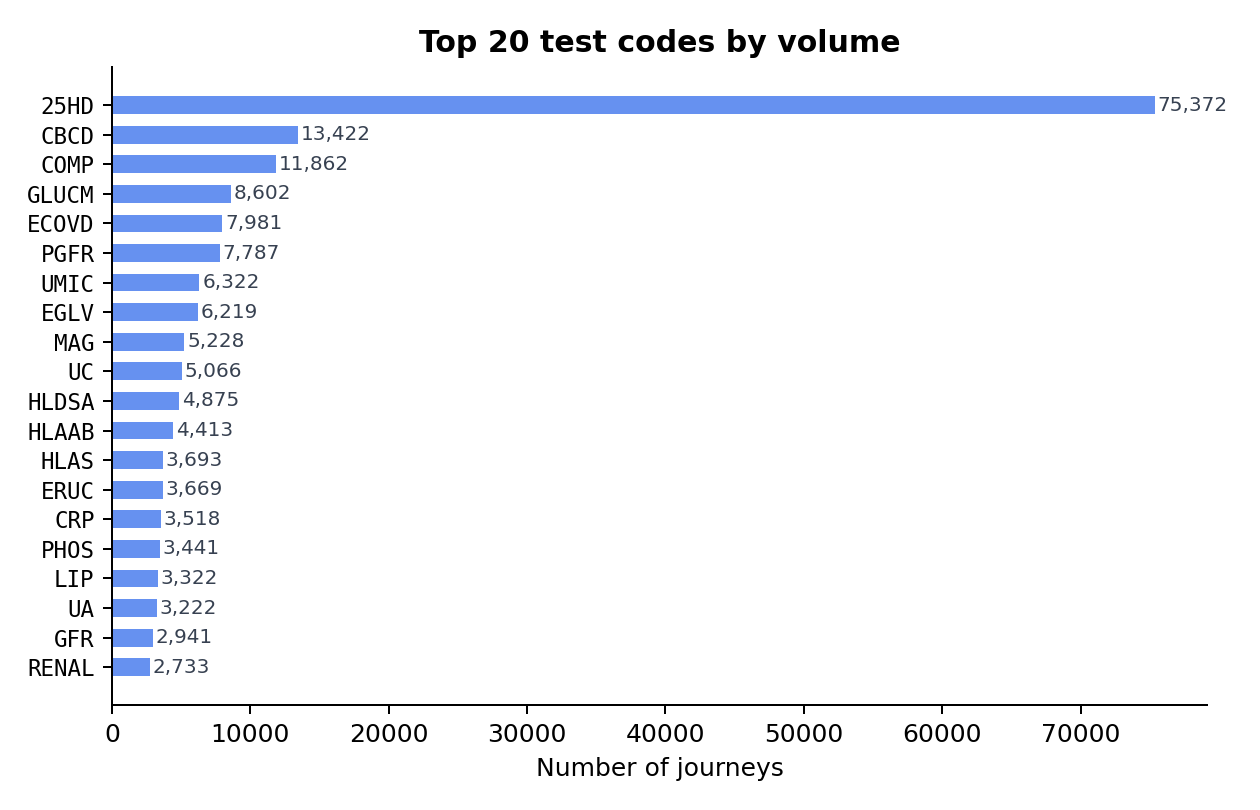
Pick any two. Click a stage to see each distribution.
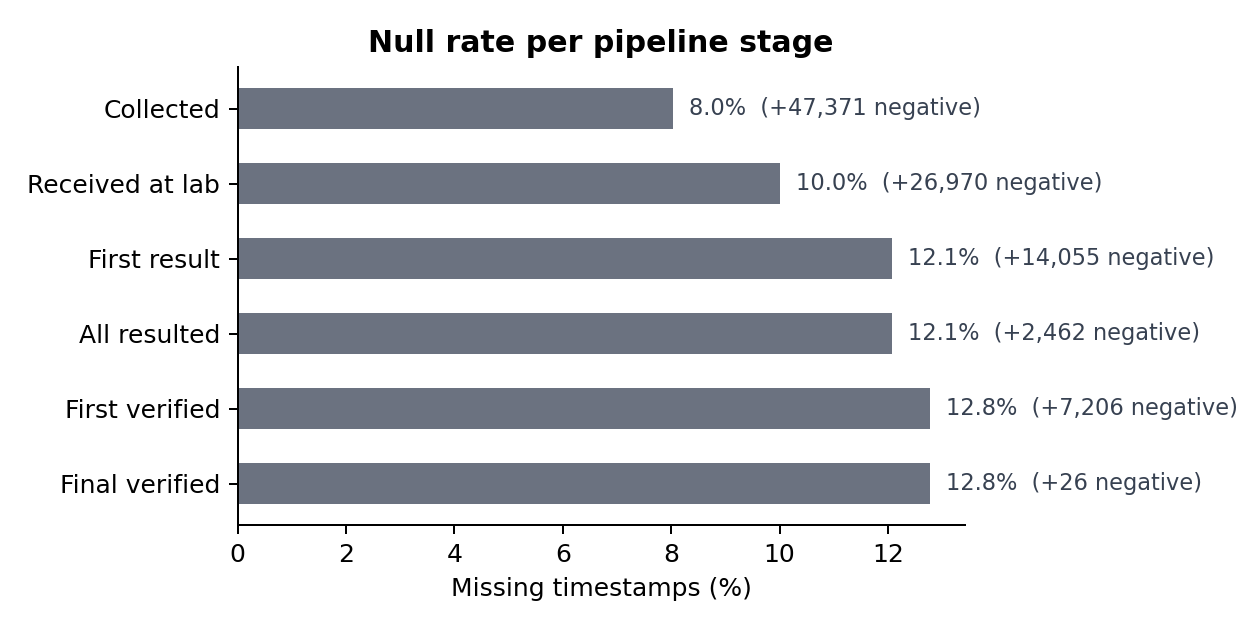
Fraction lost before reaching each stage. Click for counts.